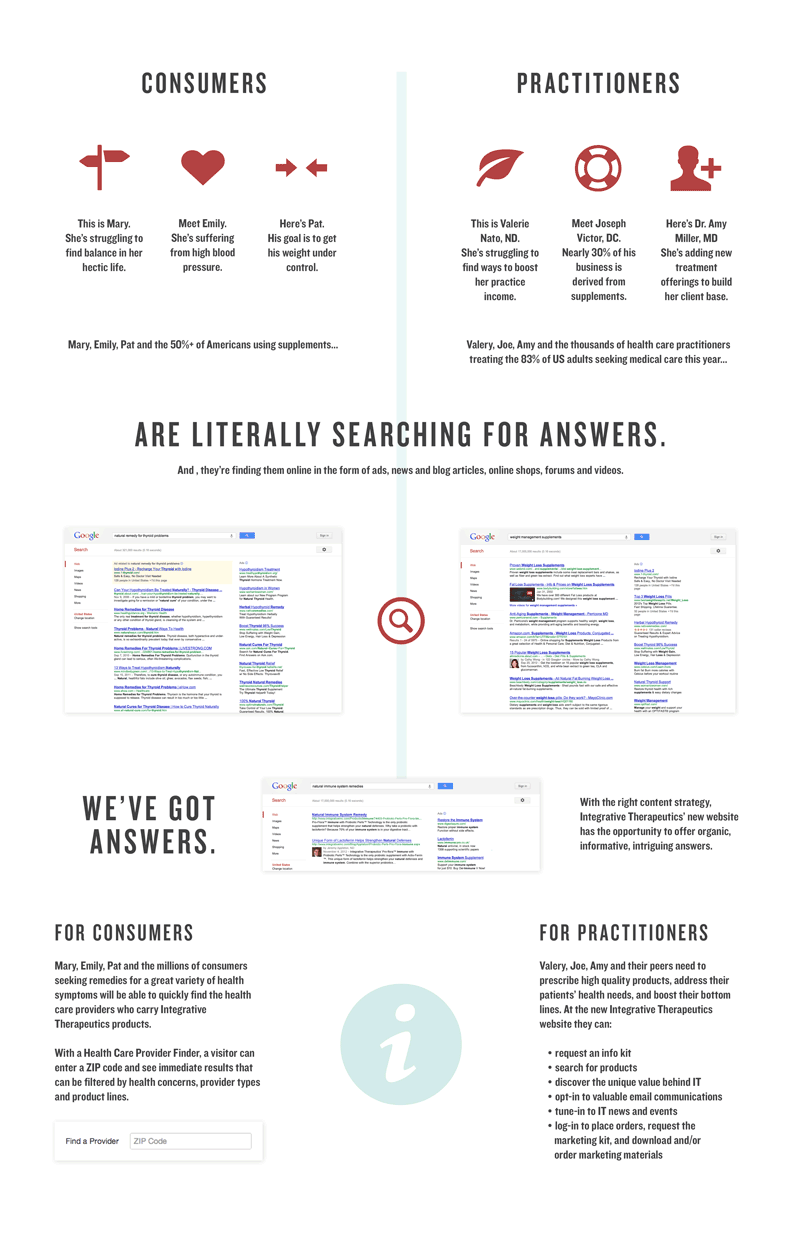
An infographic is a visual representation of information, data or knowledge and is created to make the complex easier to understand. An infographic is very effective because it’s a visual element. Since fifty percent of the human brain is devoted to visual function, images are processed faster than text. So, representing a complicated process in an infographic is easier and quicker to understand.
The best infographics express rich, objective data in a way that’s more accessible and engaging than a dense spreadsheet or boring pie chart. They should be concise, creative (yet educational) and be able to convey a burst of data in a portable package. They can be a powerful marketing tool because they are easily sharable, can enhance SEO and support your brand identity.
Entrepreneur magazine recently published seven things to consider when developing an infographic for your business:
- UTILITY. The best infographics are entertaining, educational and intrinsically useful.
- DATA. Infographics should be based on fact, not opinion.
- STORY. The best infographics have a key idea and a story behind it.
- LOGIC. Organize the information in a logical way without undue complexity.
- DESIGN. Use color, typography, illustrations, animation, video, charts and text.
- QUALITY. Make sure your infographic is error-free.
- PROMOTION. Create an infographic that others will want to share on social media sites with a string of code that links back to you.
At JD, we pair a seasoned strategist with a talented graphic designer to create engaging and easy-to-understand infographics. For those with limited resources, there are many DIY infographic sites that offer templates and color schemes for creation of infographics:
